The Omicron wall
The situation as of December 23rd#
Recently authorities in many countries are getting nervous about the critical infrastructure such as water, gas, electricity and of course hospitals, firefighters and police. At the same time a record high number of flights have been cancelled due to quarantined crews. All of this happens right after the Omicron mutant arrived. Looking at the 7-day incidence gives a first hint of the situation:
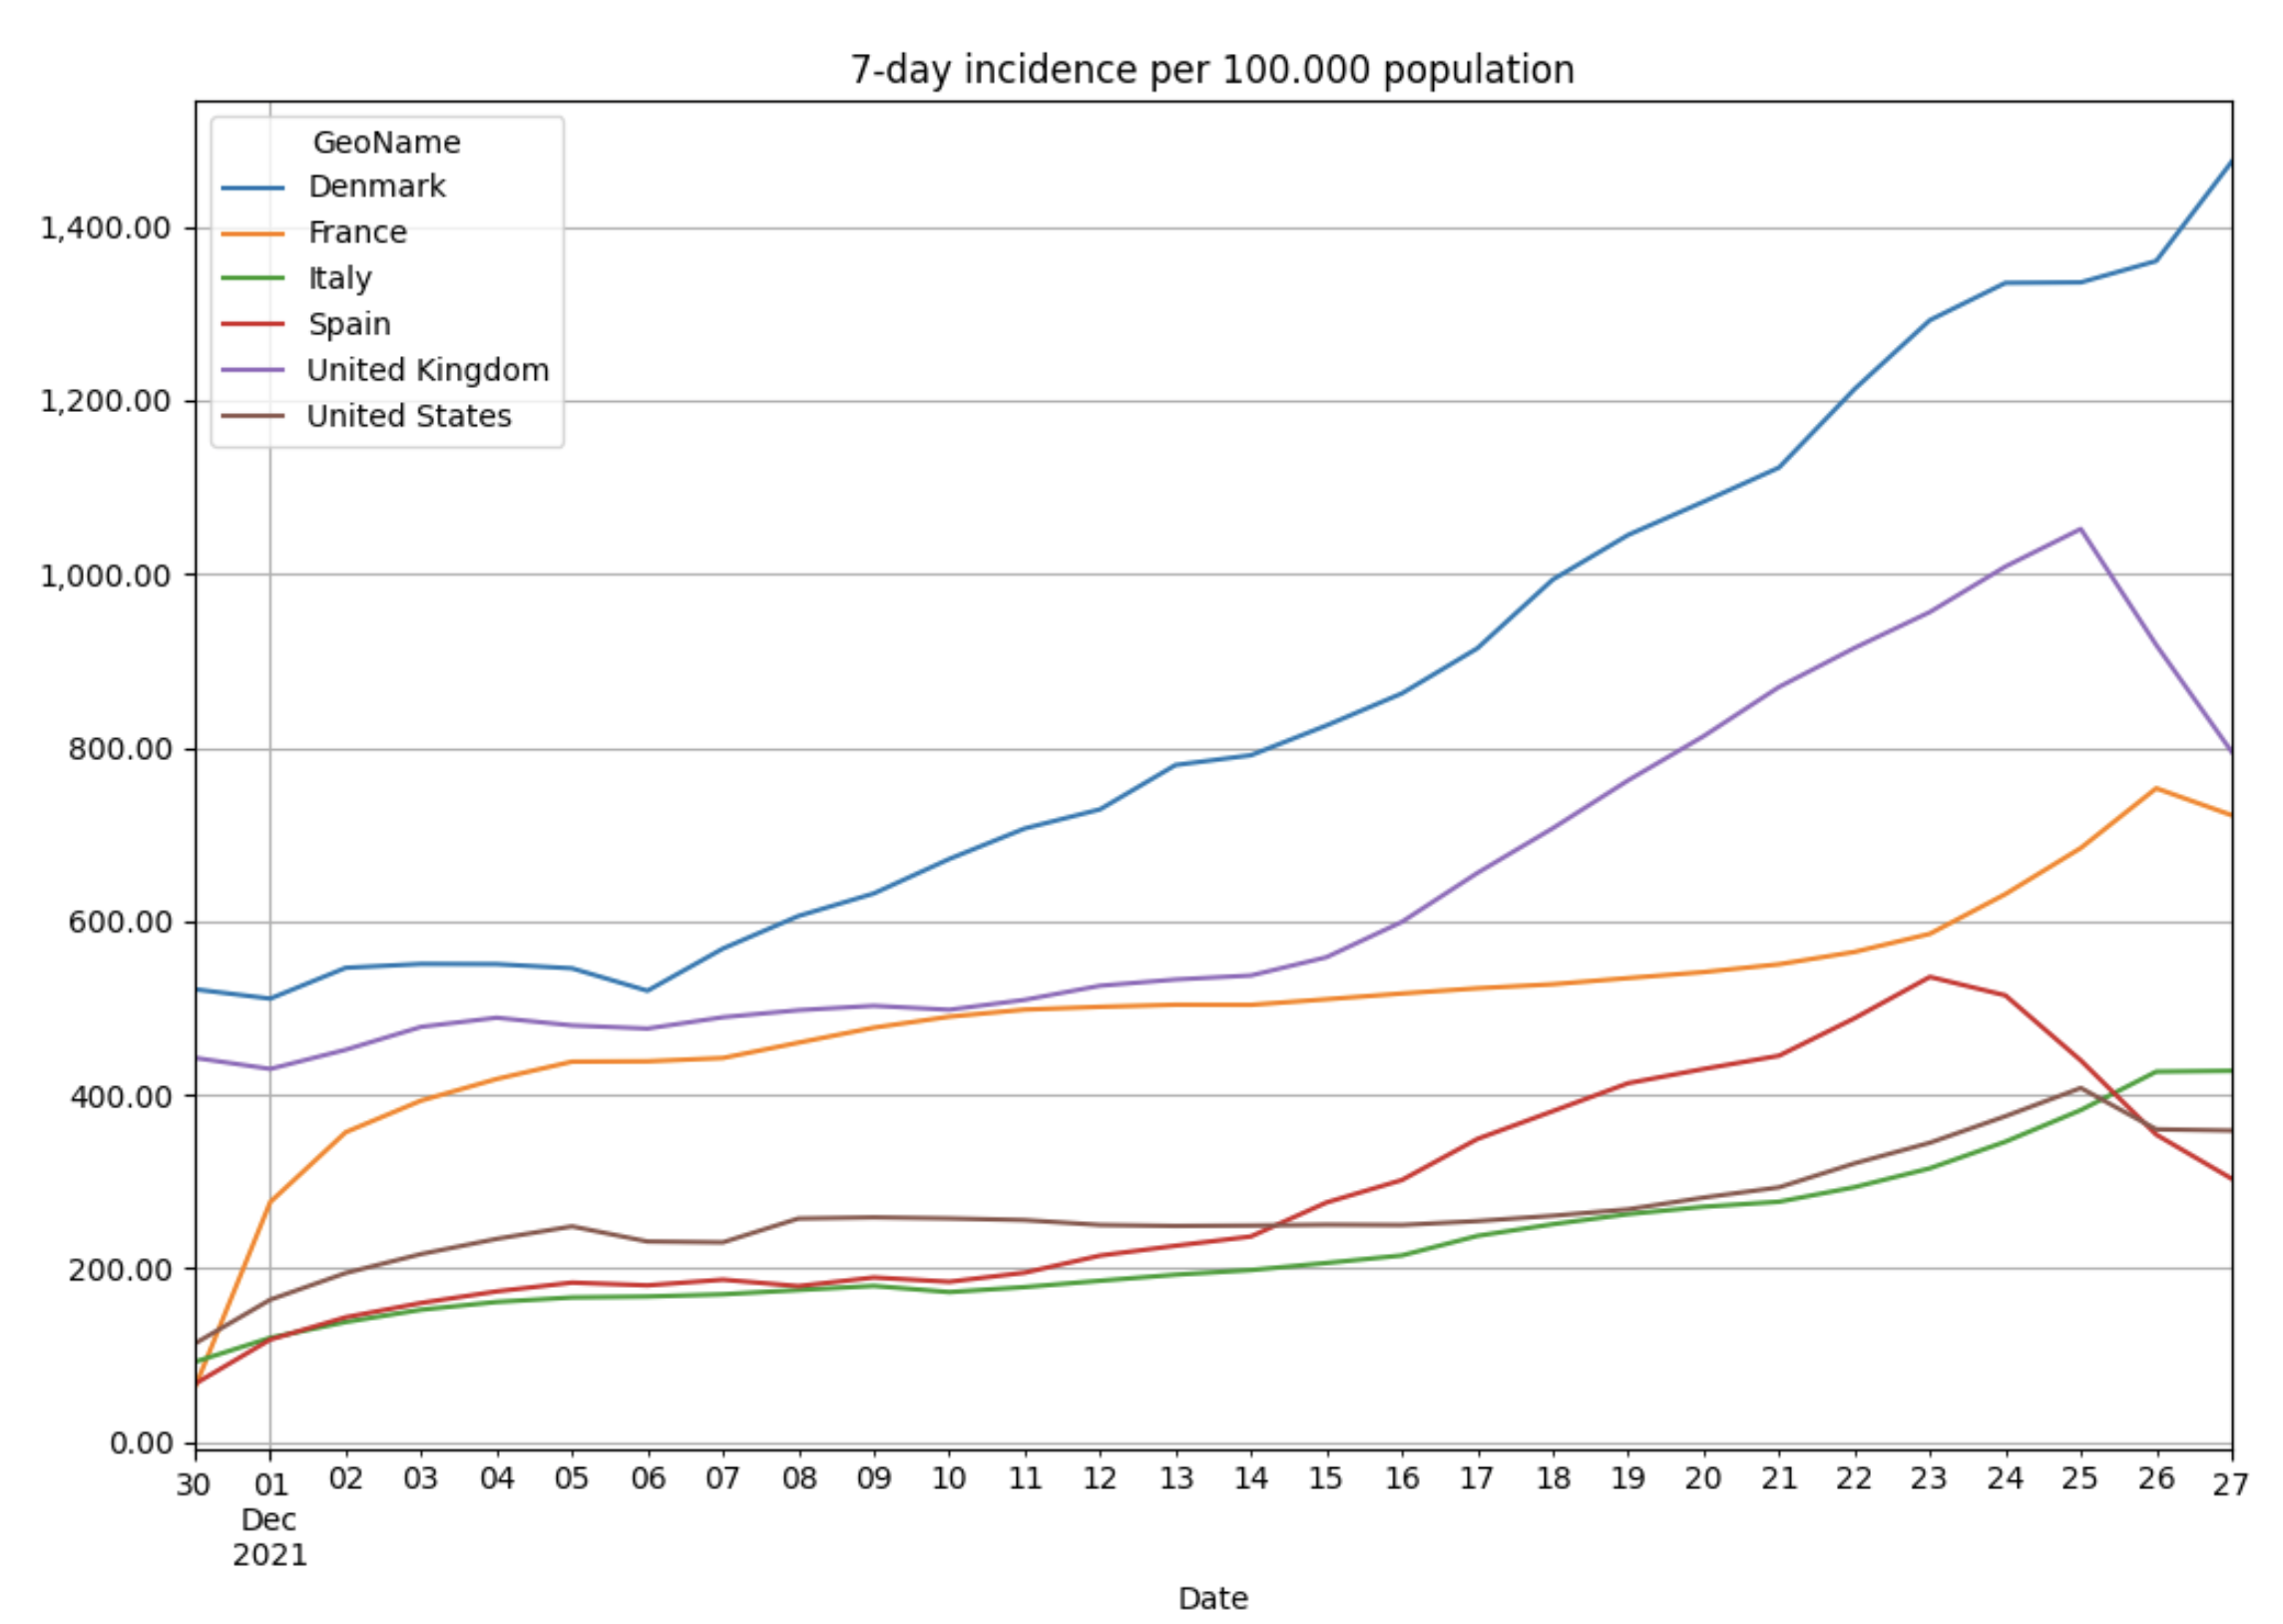
Don’t look too much to the right of the chart. During Christmas reporting is delayed so we can’t trust the numbers reported after December 23rd. Instead focus on the scale of the y-axis. It ends at 1400. That means, that 1400 new infections have been reported per 100.000 capita in the last seven days in Denmark. In other words 1,4% of the capita are infected per week. Many other countries are showing a similar rise of infections.
Intention of this post#
For many people an exponential growth is an abstract term that exceeds the imagination of a dynamic growth. The intention of this post is to make exponential growth more touchable for people which don’t have a mathematical background. It’s not to describe a pandemic in a model such as the different SIR models in all of their variations. For this you may google them or start on my favorite Wikipedia website for an introduction. Instead we will just list one formulary to calculate how quick infections can grow. As a consequence it’s all based on a Excel file allowing people to change and modify it without having any programming skills.
Exponential growth revisited#
The first number that was interesting when it all started in February 2020 was the doubling number number. This number describes the time in days it takes to double the number of infections. At that time we had a doubling time of 1-3 days before first actions took place and the doubling time came down to 8 days. At that time a friend an me started to calculate it using Excel. Every day we updated the sheet by the infection numbers for Italy and Germany that had been published in the newspaper:
| Date | Cases | Quotient | Growth | Growth absolute | Lowpass | Doubling-time [Days] | Comment |
|---|---|---|---|---|---|---|---|
| 20.02.20 | 4 | ||||||
| 21.02.20 | 21 | 5,25000 | 425% | 17 | 0,41800 | ||
| 22.02.20 | 79 | 3,76190 | 276% | 58 | 4,50595 | 0,52316 | Codogno lockdown |
| 23.02.20 | 149 | 1,88608 | 89% | 70 | 3,63266 | 1,09243 | |
| 24.02.20 | 229 | 1,53691 | 54% | 80 | 2,39496 | 1,61281 | |
| 25.02.20 | 322 | 1,40611 | 41% | 93 | 1,60970 | 2,03371 | |
| 26.02.20 | 471 | 1,46273 | 46% | 149 | 1,46859 | 1,82260 | |
| 27.02.20 | 650 | 1,38004 | 38% | 179 | 1,41630 | 2,15187 | |
| 28.02.20 | 888 | 1,36615 | 37% | 238 | 1,40298 | 2,22163 | |
| 29.02.20 | 1128 | 1,27027 | 27% | 240 | 1,33882 | 2,89741 | |
| 01.03.20 | 1694 | 1,50177 | 50% | 566 | 1,37940 | 1,70455 | |
| 02.03.20 | 2036 | 1,20189 | 20% | 342 | 1,32464 | 3,76927 | |
| 03.03.20 | 2502 | 1,22888 | 23% | 466 | 1,31085 | 3,36311 | |
| 04.03.20 | 3089 | 1,23461 | 23% | 587 | 1,22179 | 3,28885 | Schools closing |
| 05.03.20 | 3858 | 1,24895 | 25% | 769 | 1,23748 | 3,11805 | |
| 06.03.20 | 4636 | 1,20166 | 20% | 778 | 1,22841 | 3,77319 | |
| 07.03.20 | 5883 | 1,26898 | 27% | 1247 | 1,23986 | 2,90976 | |
| 08.03.20 | 7375 | 1,25361 | 25% | 1492 | 1,24142 | 3,06663 | Lombardia lockdown |
| 09.03.20 | 9172 | 1,24366 | 24% | 1797 | 1,25542 | 3,17871 | Italy lockdown |
| 10.03.20 | 10149 | 1,10652 | 11% | 977 | 1,20126 | 6,84794 | |
| 11.03.20 | 12462 | 1,22790 | 23% | 2313 | 1,19270 | 3,37612 | |
| 12.03.20 | 15113 | 1,21273 | 21% | 2651 | 1,18238 | 3,59383 | |
| 13.03.20 | 17660 | 1,16853 | 17% | 2547 | 1,20305 | 4,45047 | |
| 14.03.20 | 21157 | 1,19802 | 20% | 3497 | 1,19309 | 3,83657 | |
| 15.03.20 | 24747 | 1,16968 | 17% | 3590 | 1,17874 | 4,42246 | |
| 16.03.20 | 27980 | 1,13064 | 13% | 3233 | 1,16611 | 5,64518 | |
| 17.03.20 | 31506 | 1,12602 | 13% | 3526 | 1,14211 | 5,84008 | |
| 18.03.20 | 35713 | 1,13353 | 13% | 4207 | 1,13006 | 5,53028 | |
| 19.03.20 | 41035 | 1,14902 | 15% | 5322 | 1,13619 | 4,98988 | |
| 20.03.20 | 47021 | 1,14588 | 15% | 5986 | 1,14281 | 5,09035 | |
| 21.03.20 | 53578 | 1,13945 | 14% | 6557 | 1,14478 | 5,30967 | |
| 22.03.20 | 59138 | 1,10377 | 10% | 5560 | 1,12970 | 7,02027 | |
| 23.03.20 | 63927 | 1,08098 | 8% | 4789 | 1,10807 | 8,90155 |
In the beginning the number of infections was doubling every 1-3 days. After first actions have been taken the number was going up to 5-8 days. Later on when more and more actions had been taken the doubling time increased further until it reached a point when it became useless to make use of it. In such time other parameters such as the incidence and the R number made it easier to assess the pandemic.
With Omicron this is changing again and not into a good direction. The week before Christmas London reported a doubling time of 1-2 days. At the same time UK and Amsterdam estimated the doubling time to 2-3 days. However with this low numbers we can now use the double time again to understand why authorities are getting nervous again.
Simulating the effect of the doubling time#
A simple Excel sheet allows you to test the exponential growth and feed it with data of your own country. This a short excerpt of the first table in the Excel file. Based on the start value (the only cell that should be updated) it calculates the number of infections per date (vertically) for different doubling times (horizontally):
| start value | 100 | |||||||||||
|---|---|---|---|---|---|---|---|---|---|---|---|---|
| 1 means that number of infections is doubling every day | 2 means a doubling every two days | |||||||||||
| oubling time | 1 | 1,1 | 1,2 | .. | 1,9 | 2 | 2,1 | .. | 2,9 | 3 | 3,1 | |
| multiplier | 2,00000 | 1,87786 | 1,78180 | .. | 1,44025 | 1,41421 | 1,39107 | .. | 1,27000 | 1,25992 | 1,25057 | |
| date | day | infected | infected | infected | .. | infected | infected | infected | .. | infected | infected | infected |
| 21.12.21 | 1 | 100 | 100 | 100 | .. | 100 | 100 | 100 | .. | 100 | 100 | 100 |
| 22.12.21 | 2 | 200 | 188 | 178 | .. | 144 | 141 | 139 | .. | 127 | 126 | 125 |
| 23.12.21 | 3 | 400 | 353 | 317 | .. | 207 | 200 | 194 | .. | 161 | 159 | 156 |
| 24.12.21 | 4 | 800 | 662 | 566 | .. | 299 | 283 | 269 | .. | 205 | 200 | 196 |
| 25.12.21 | 5 | 1.600 | 1.244 | 1.008 | .. | 430 | 400 | 374 | .. | 260 | 252 | 245 |
| 26.12.21 | 6 | 3.200 | 2.335 | 1.796 | .. | 620 | 566 | 521 | .. | 330 | 317 | 306 |
| 27.12.21 | 7 | 6.400 | 4.385 | 3.200 | .. | 893 | 800 | 725 | .. | 420 | 400 | 383 |
| 28.12.21 | 8 | 12.800 | 8.235 | 5.702 | .. | 1.285 | 1.131 | 1.008 | .. | 533 | 504 | 478 |
| 29.12.21 | 9 | 25.600 | 15.464 | 10.159 | .. | 1.851 | 1.600 | 1.402 | .. | 677 | 635 | 598 |
| 30.12.21 | 10 | 51.200 | 29.038 | 18.102 | .. | 2.666 | 2.263 | 1.950 | .. | 859 | 800 | 748 |
| 31.12.21 | 11 | 102.400 | 54.530 | 32.254 | .. | 3.840 | 3.200 | 2.713 | .. | 1.092 | 1.008 | 936 |
| 01.01.22 | 12 | 204.800 | 102.400 | 57.470 | .. | 5.531 | 4.525 | 3.774 | .. | 1.386 | 1.270 | 1.170 |
| 02.01.22 | 13 | 409.600 | 192.293 | 102.400 | .. | 7.966 | 6.400 | 5.250 | .. | 1.761 | 1.600 | 1.463 |
| 03.01.22 | 14 | 819.200 | 361.100 | 182.456 | .. | 11.473 | 9.051 | 7.303 | .. | 2.236 | 2.016 | 1.830 |
| 04.01.22 | 15 | 1.638.400 | 678.095 | 325.100 | .. | 16.524 | 12.800 | 10.159 | .. | 2.840 | 2.540 | 2.288 |
| 05.01.22 | 16 | 3.276.800 | 1.273.370 | 579.262 | .. | 23.799 | 18.102 | 14.132 | .. | 3.606 | 3.200 | 2.862 |
| 06.01.22 | 17 | 6.553.600 | 2.391.212 | 1.032.127 | .. | 34.276 | 25.600 | 19.659 | .. | 4.580 | 4.032 | 3.579 |
| 07.01.22 | 18 | 13.107.200 | 4.490.366 | 1.839.042 | .. | 49.366 | 36.204 | 27.347 | .. | 5.816 | 5.080 | 4.475 |
| 08.01.22 | 19 | 26.214.400 | 8.432.287 | 3.276.800 | .. | 71.099 | 51.200 | 38.041 | .. | 7.387 | 6.400 | 5.596 |
| 09.01.22 | 20 | 52.428.800 | 15.834.670 | 5.838.594 | .. | 102.400 | 72.408 | 52.918 | .. | 9.381 | 8.063 | 6.999 |
| 10.01.22 | 21 | 104.857.600 | 29.735.322 | 10.403.192 | .. | 147.481 | 102.400 | 73.613 | .. | 11.914 | 10.159 | 8.752 |
| 11.01.22 | 22 | 209.715.200 | 55.838.826 | 18.536.380 | .. | 212.409 | 144.815 | 102.400 | .. | 15.131 | 12.800 | 10.945 |
| 12.01.22 | 23 | 419.430.400 | 104.857.600 | 33.028.074 | .. | 305.922 | 204.800 | 142.445 | .. | 19.217 | 16.127 | 13.688 |
| 13.01.22 | 24 | 838.860.800 | 196.908.084 | 58.849.338 | .. | 440.603 | 289.631 | 198.151 | .. | 24.405 | 20.319 | 17.118 |
| 14.01.22 | 25 | 1.677.721.600 | 369.766.173 | 104.857.600 | .. | 634.577 | 409.600 | 275.640 | .. | 30.994 | 25.600 | 21.407 |
| 15.01.22 | 26 | 3.355.443.200 | 694.369.779 | 186.835.003 | .. | 913.947 | 579.262 | 383.434 | .. | 39.363 | 32.254 | 26.771 |
| 16.01.22 | 27 | 6.710.886.400 | 1.303.930.497 | 332.902.129 | .. | 1.316.309 | 819.200 | 533.382 | .. | 49.991 | 40.637 | 33.479 |
| 17.01.22 | 28 | 13.421.772.800 | 2.448.601.298 | 593.164.160 | .. | 1.895.809 | 1.158.524 | 741.969 | .. | 63.488 | 51.200 | 41.867 |
| 18.01.22 | 29 | 26.843.545.600 | 4.598.134.893 | 1.056.898.380 | .. | 2.730.433 | 1.638.400 | 1.032.127 | .. | 80.630 | 64.508 | 52.358 |
| 19.01.22 | 30 | 53.687.091.200 | 8.634.661.965 | 1.883.178.824 | .. | 3.932.497 | 2.317.048 | 1.435.757 | .. | 102.400 | 81.275 | 65.477 |
| 20.01.22 | 31 | 107.374.182.400 | 16.214.702.045 | 3.355.443.200 | .. | 5.663.765 | 3.276.800 | 1.997.232 | .. | 130.048 | 102.400 | 81.883 |
You can see that the numbers are growing pretty fast and that’s the reason why authorities are getting nervous. Keep in mind that European countries are vaccinated at rates of 65-85%. Roughly 70% of the people are fully vaccinated (meaning at least two doses) in England, while in the Netherlands this rate is 66%. Maybe different vaccines are also playing a role in the doubling time of Omicron. However you can take a deep dive into the numbers and take your consequences regarding following the rules that have been applied to overcome this next wave.
A closer look to Germany#
In a second table in the Excel sheet you will see calculations based on the latest estimation of the Robert Koch Institute in Germany. On December 22nd they published the newly Daily Review of Omicron cases. Unfortunately this paper is not available in English but it publishes two important numbers:
- 3198 cases of Omicron infections are expected to be active in Germany
- The doubling time of Omicron is expected to be 3-4 days
Based on this two numbers the second table is calculating the spread of Omicron in the next weeks in Germany and it’s anything else then harmless:
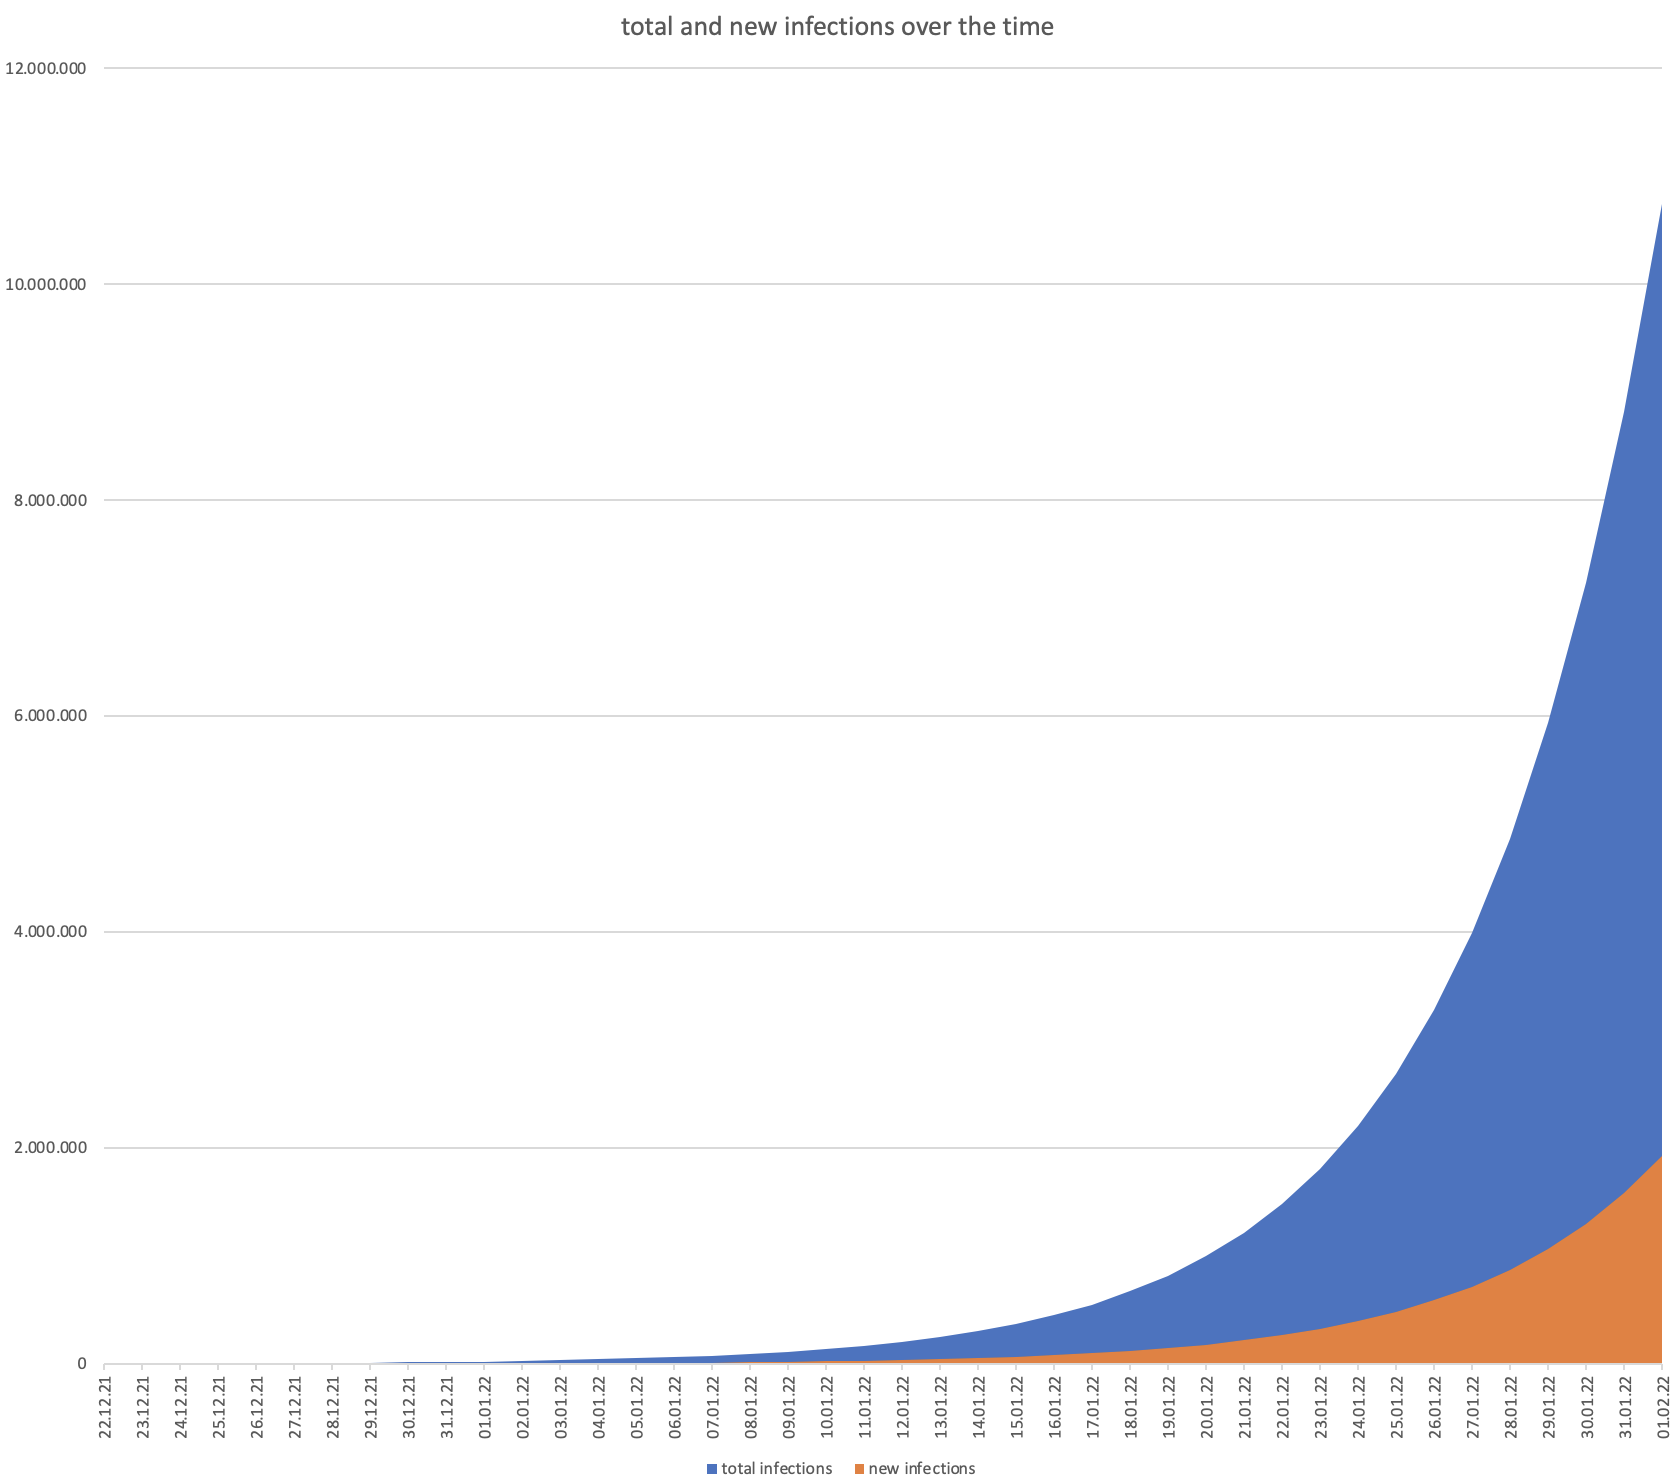
And here are the numbers:
| start value | 3198 | ||
|---|---|---|---|
| doubling time | 3,5 | do not edit | |
| multiplier | 1,21901 | do not edit | |
| day | date | total infections | new infections |
| 1 | 22.12.21 | 3.198 | |
| 2 | 23.12.21 | 3.898 | 700 |
| 3 | 24.12.21 | 4.752 | 854 |
| 4 | 25.12.21 | 5.793 | 1.041 |
| 5 | 26.12.21 | 7.062 | 1.269 |
| 6 | 27.12.21 | 8.608 | 1.547 |
| 7 | 28.12.21 | 10.494 | 1.885 |
| 8 | 29.12.21 | 12.792 | 2.298 |
| 9 | 30.12.21 | 15.594 | 2.802 |
| 10 | 31.12.21 | 19.009 | 3.415 |
| 11 | 01.01.22 | 23.172 | 4.163 |
| 12 | 02.01.22 | 28.247 | 5.075 |
| 13 | 03.01.22 | 34.434 | 6.186 |
| 14 | 04.01.22 | 41.975 | 7.541 |
| 15 | 05.01.22 | 51.168 | 9.193 |
| 16 | 06.01.22 | 62.374 | 11.206 |
| 17 | 07.01.22 | 76.035 | 13.661 |
| 18 | 08.01.22 | 92.688 | 16.653 |
| 19 | 09.01.22 | 112.988 | 20.300 |
| 20 | 10.01.22 | 137.734 | 24.746 |
| 21 | 11.01.22 | 167.900 | 30.166 |
| 22 | 12.01.22 | 204.672 | 36.772 |
| 23 | 13.01.22 | 249.498 | 44.826 |
| 24 | 14.01.22 | 304.141 | 54.643 |
| 25 | 15.01.22 | 370.753 | 66.611 |
| 26 | 16.01.22 | 451.952 | 81.200 |
| 27 | 17.01.22 | 550.936 | 98.984 |
| 28 | 18.01.22 | 671.599 | 120.663 |
| 29 | 19.01.22 | 818.688 | 147.089 |
| 30 | 20.01.22 | 997.992 | 179.304 |
| 31 | 21.01.22 | 1.216.566 | 218.574 |
| 32 | 22.01.22 | 1.483.010 | 266.444 |
| 33 | 23.01.22 | 1.807.810 | 324.799 |
| 34 | 24.01.22 | 2.203.745 | 395.935 |
| 35 | 25.01.22 | 2.686.395 | 482.650 |
| 36 | 26.01.22 | 3.274.752 | 588.357 |
| 37 | 27.01.22 | 3.991.967 | 717.215 |
| 38 | 28.01.22 | 4.866.263 | 874.295 |
| 39 | 29.01.22 | 5.932.041 | 1.065.778 |
| 40 | 30.01.22 | 7.231.239 | 1.299.198 |
| 41 | 31.01.22 | 8.814.979 | 1.583.740 |
Having this in mind it becomes clear that the expert committee of the German government requested immediate reactions in their statement as of December 20th (sorry, again only available in German language). Unfortunately the German government didn’t followed the recommendations and decided for contact limitations starting on December 28th.
Now as you perhaps know a bit more on exponential growth you can judge if this is a good idea or not.