Covid-19 analysis repository on GitHub
Repository#
We supply source code to get and process the data about Covid-19 infections around the world over the time. The documentation of the source code can be found here. Beside some Jupyter Notebooks, a REST API and Windows and MacOS applications to access it, you will find python classes to automatically download the data from the following organizations:
- World Health Organization (WHO)
The WHO publishes the data on a dashboard available on the WHO Covid-19 pages.
- European Centre for Disease Prevention and Control (ECDC)
Since 14.12.2020 the ECDC publishes only weekly numbers.
- Our World in Data (OWID)
According to the OWID website the Covid-19 data provided is coming from the COVID-19 Data Repository by the Center for Systems Science
and Engineering (CSSE) at Johns Hopkins University (JHU).
Based on that raw data we provide functions to calculate the following attributes:
| Column | Description |
|---|---|
| GeoName | The name of the country, county or city |
| GeoID | The GeoID of the country. Refer to this post to get a list of GeoIDs and country names. |
| Population | The population of the country, county or city based on 2019 data. |
| Continent | The continent of the country. In case of a city it may be the county. In case of a county it may be a federal state or region. In general it’s a grouping in a level above the meaning of the GeoName - GeoID combination. |
| DailyCases | The daily number of confirmed cases. |
| DailyDeaths | The daily number of deaths of confirmed cases |
| Cases | The overall number of confirmed infections (here called cases) since December 31st. 2019 as published by the data source. |
| Deaths | The overall number of deaths of confirmed cases. |
| PercentDeaths | The percentage of deaths of the confirmed cases. This is also called Case-Fatality-Rate (CFR) which is an estimation for the Infection-Fatality-Rate (IFR) which also includes unconfirmed (hidden or dark) infections |
| DoublingTime | The time in days after which the number of Cases are doubled |
| CasesPerMillionPopulation | The number of Cases divided by the population in million |
| DeathsPerMillionPopulation | The number of Deaths divided by the population in million |
Other functions will allow you to calculate the following additional attributes:
| Column | Description |
|---|---|
| R | An estimation of the reproduction number R0. The attribute should finally be low-pass filtered with a kernel size of 7. |
| Incidence7DayPer100Kpopulation | The accumulated 7-day incidence. That is the sum of the daily cases of the last 7 days divided by the population in 100000 people. |
| DailyCases7 | After calling add_lowpass_filter_for_attribute with the attribute name DailyCases and a filter size of 7 you will get this new attribute that represents the average number of DailyCases of the last 7 days. Of course you can filter all of the attributes given in the list above with whatever filter size. |
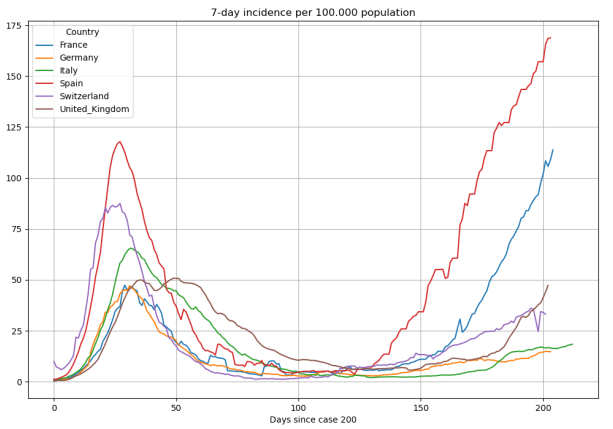
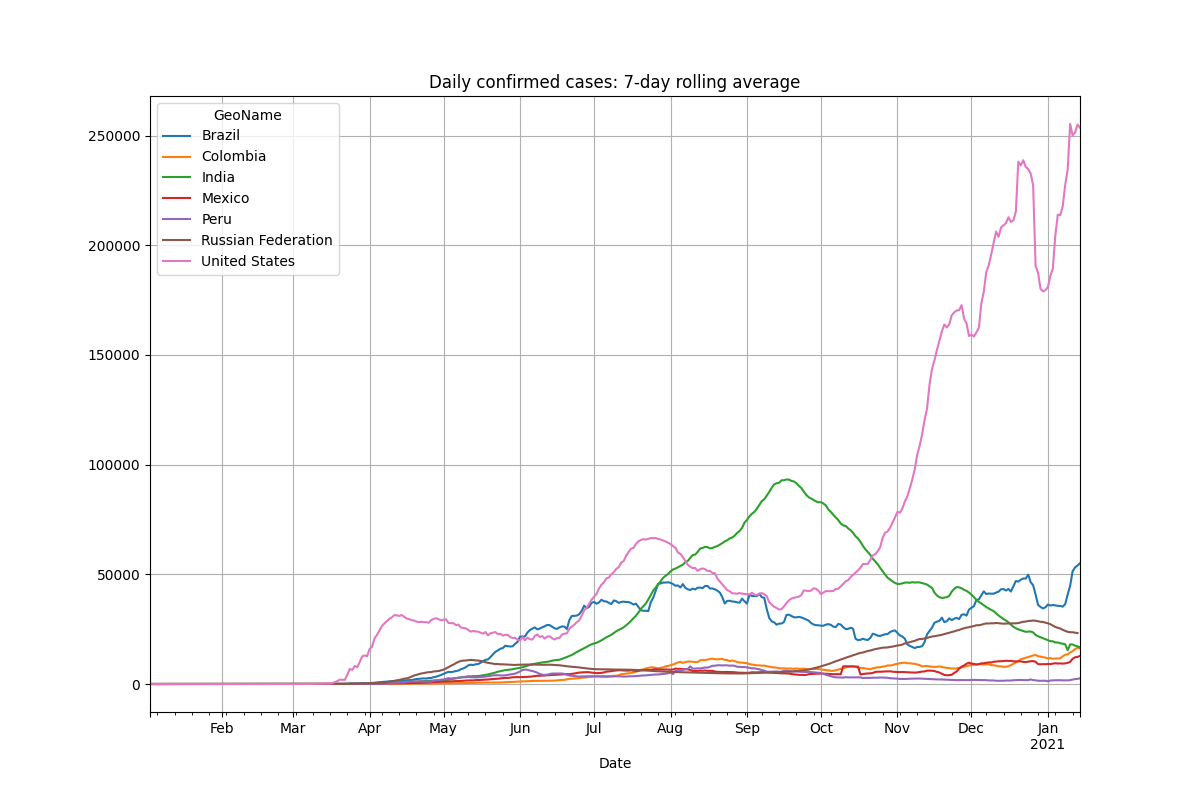
Once having the data calculated we generate plots using the matplot library such as these:
You can also generate heatmaps using pygal such as this:

All of that graphics can be published using a REST API for which you will find the sources here as well. For your convenience in getting a quick look to the data we offer the REST API on a private server that you can access here.
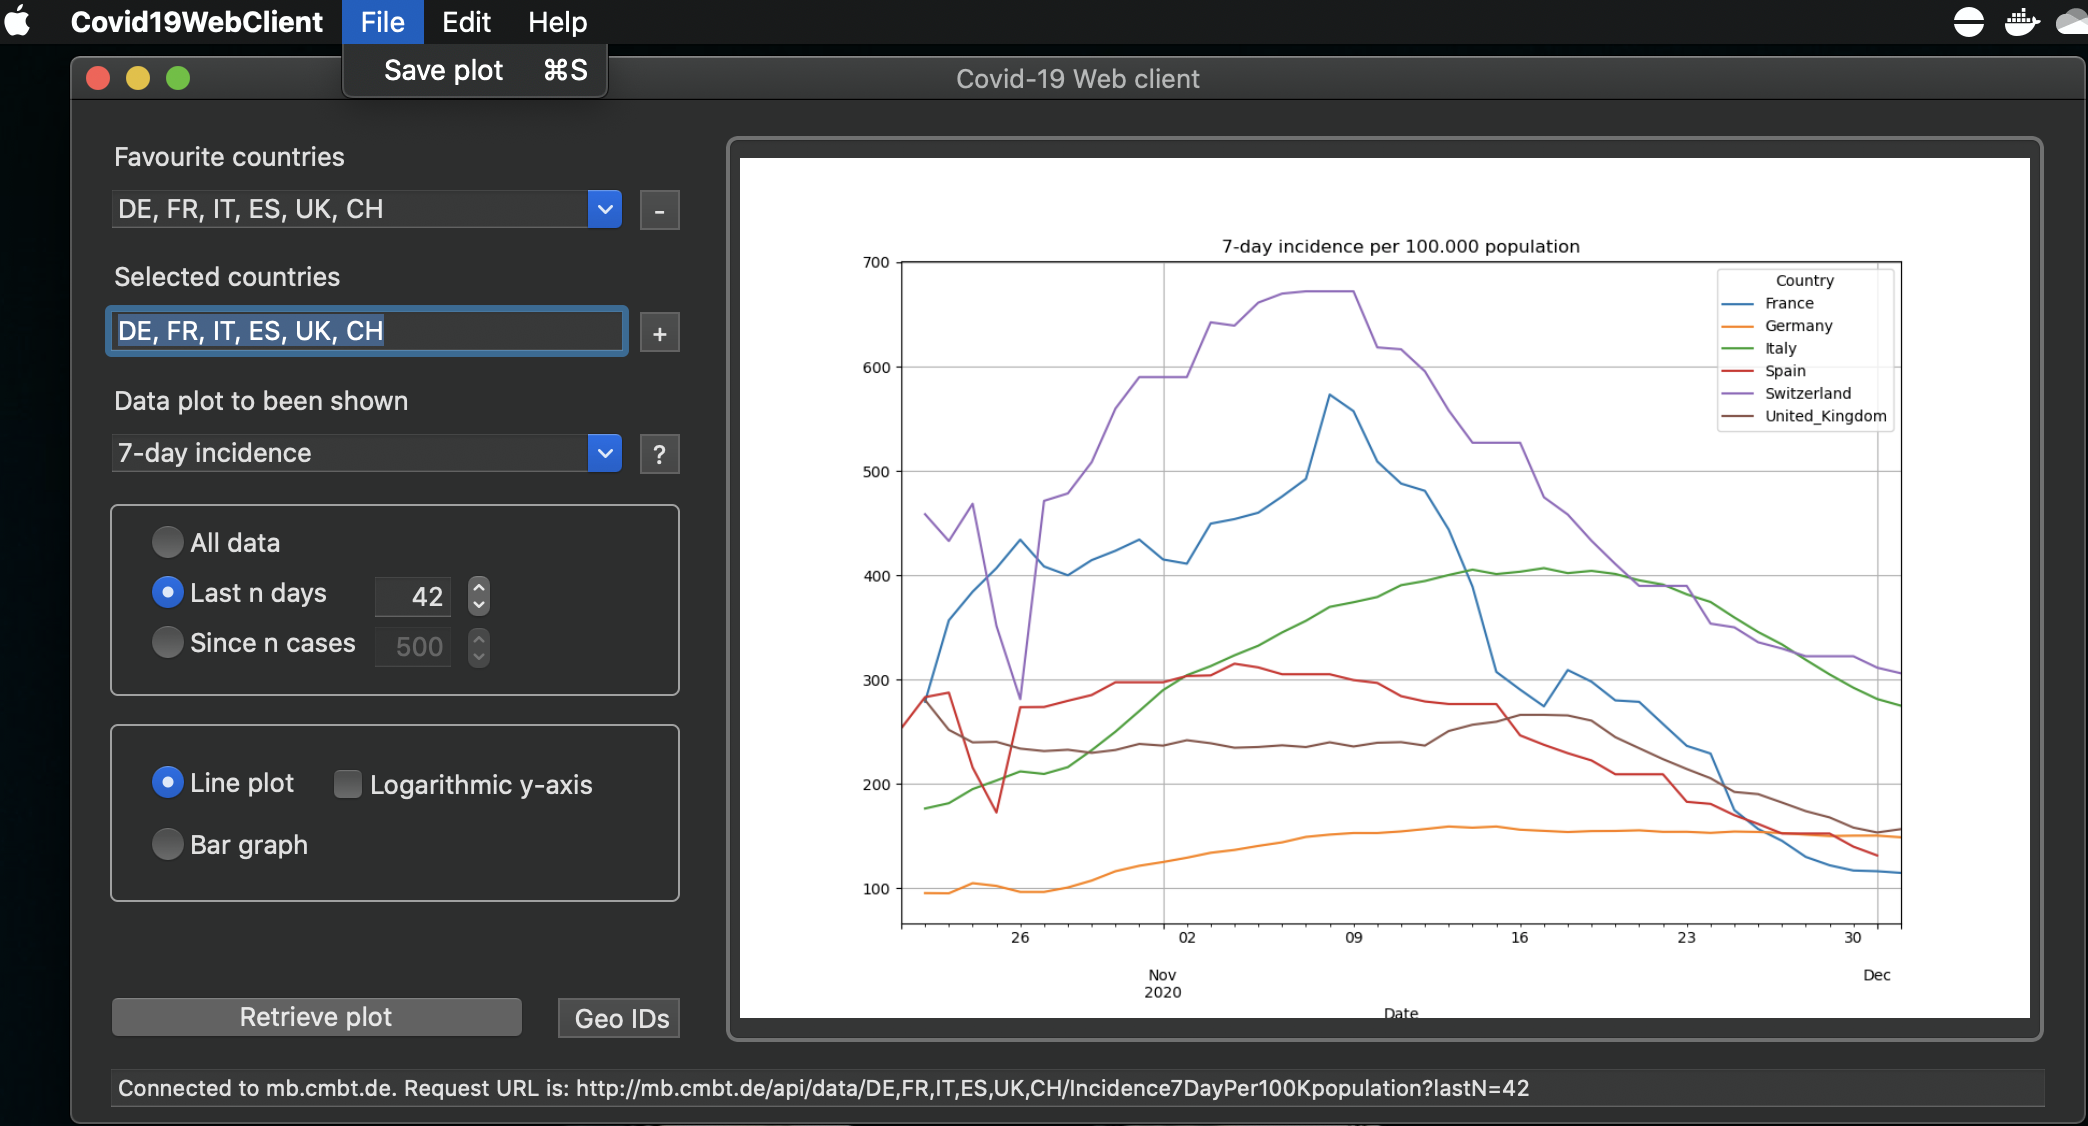
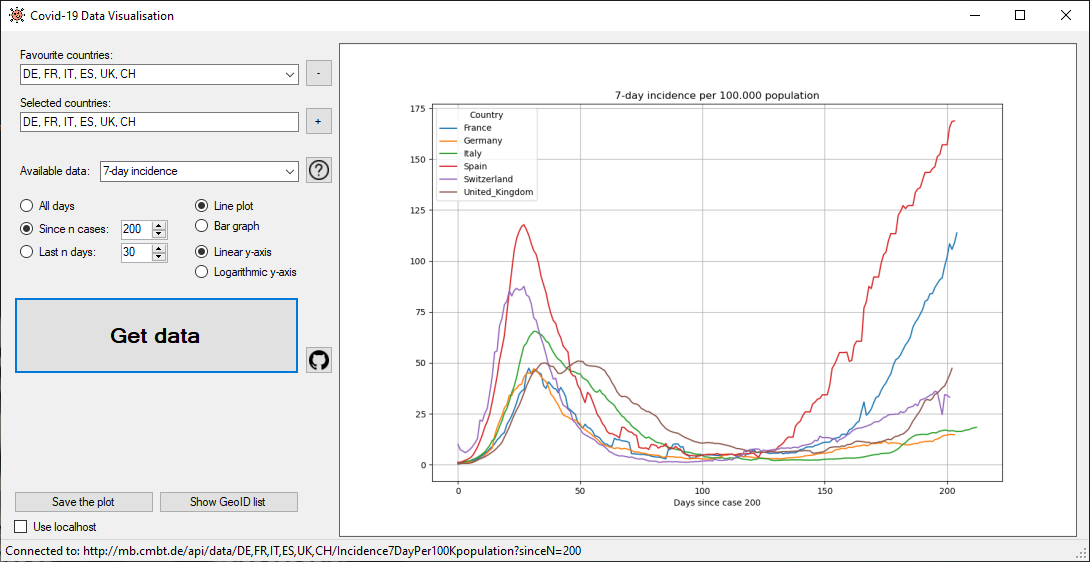
For the quick look we also offer a Windows Forms CSharp application and a MacOS Swift application. You will find the source code for them here as well and you can download the installer here. Here are some screenshots of the applications: