Covid-19 analysis version 6
New data source: Robert Koch Institute (RKI)#
The latest version of our Covid-19 analysis now provides access to the data of the German Robert Koch Institute. Using this you can get data down to county/city level in Germany. Actually connectors to two different data sources have been implemented. The first one is using the RKI-API of Marlon Lückert. This gives access to the latest numbers such as cases per German state or German counties and cities. Beside cases you will also get numbers of hospitalization, deaths and an estimation for the number of recovered people.
The second data source is the RKI master file available here. The file also includes the data by age and gender and is therefor giving a great level of detail.
Together with the data provided by the WHO, Our World In Data (OWID) and the European Centre for Disease Prevention and Control (ECDC) we now have for the first time localized data for an individual country.
New interactive maps#
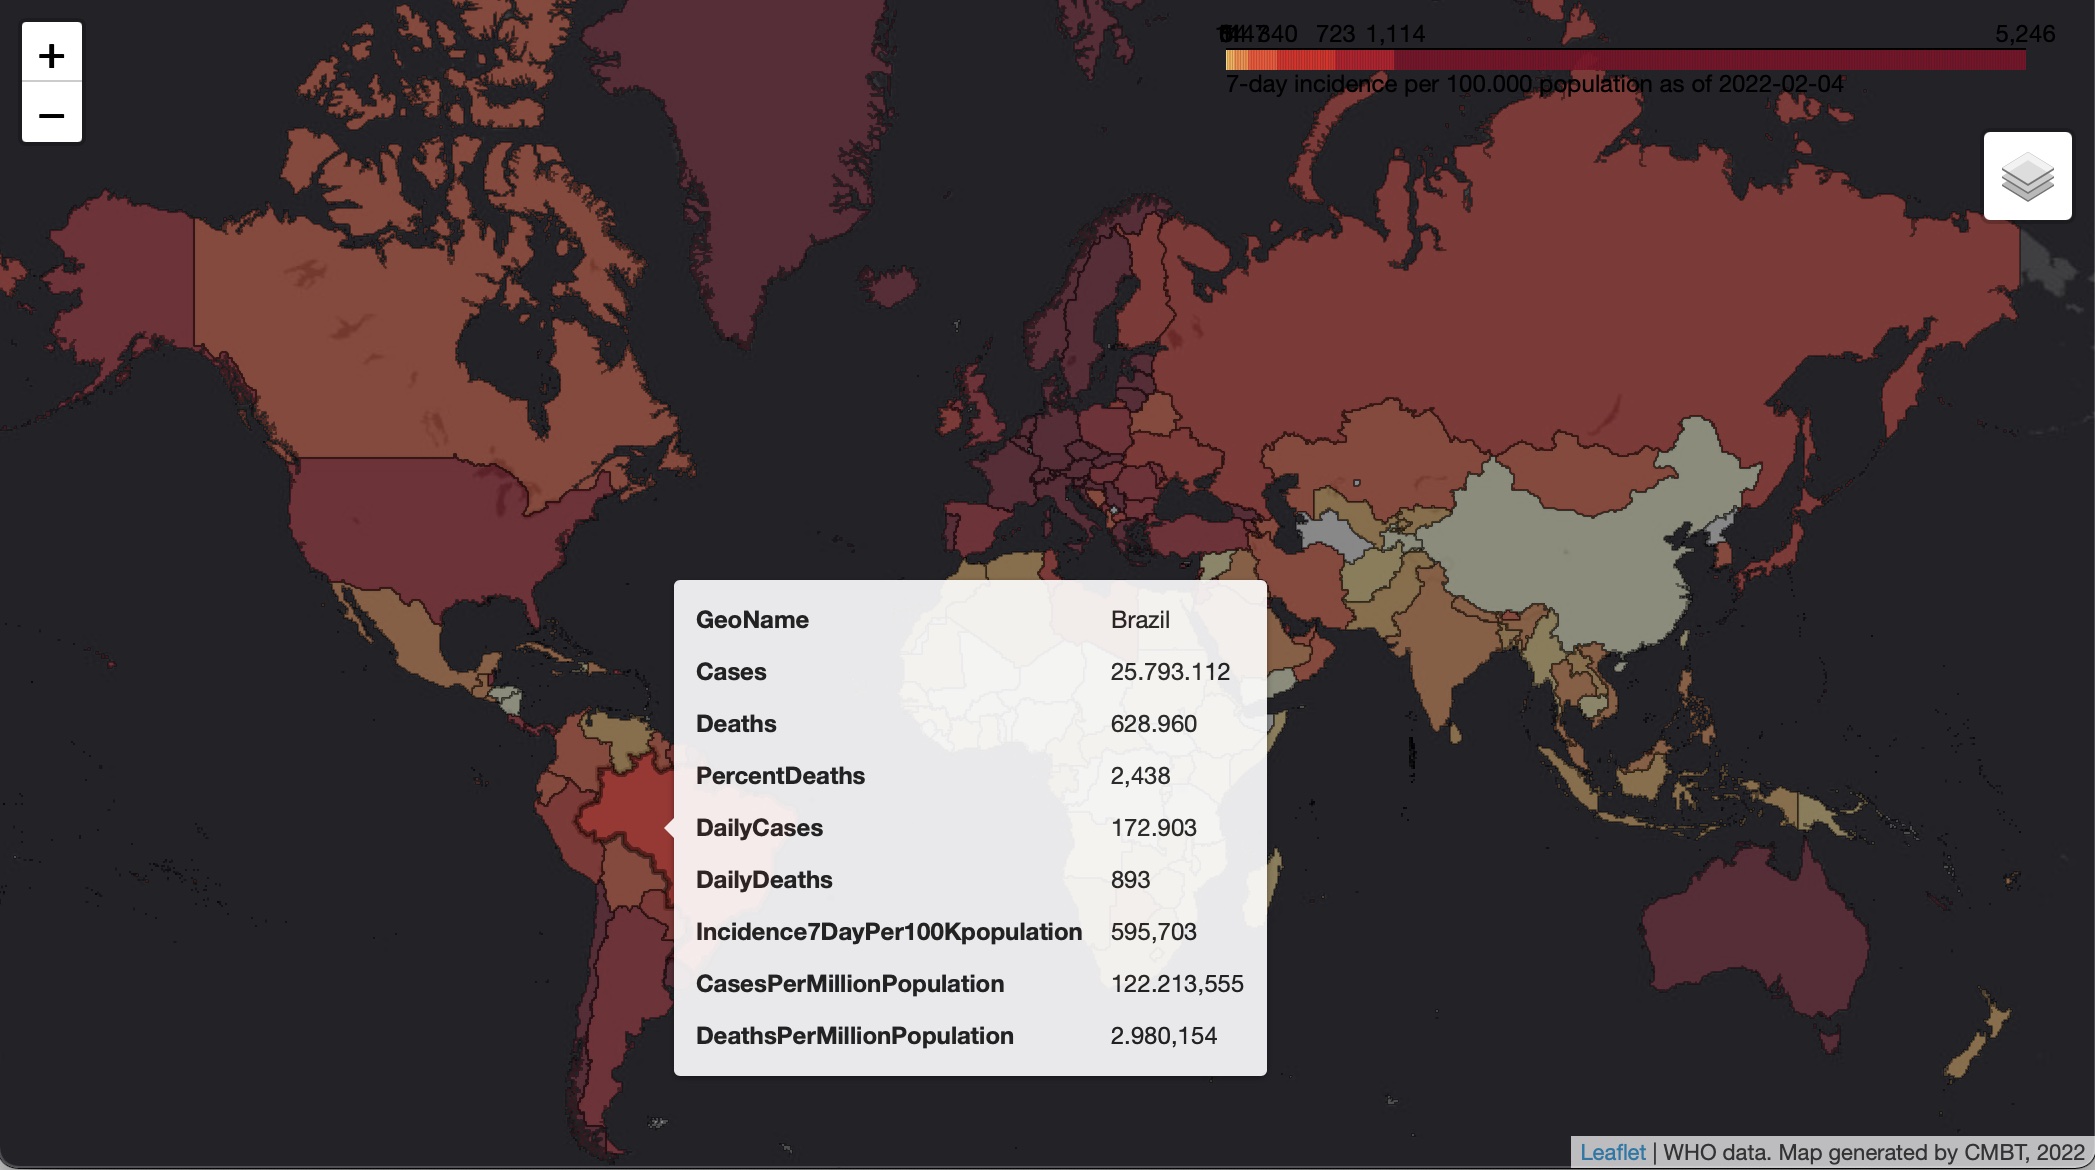
The data of the RKI or WHO can be viewed in form of interactive maps. If you follow the link you can find a list of daily updated RKI maps as well as WHO maps that are updated Tuesday to Saturday.
These maps are generated using Folium, a great library for map based data. Based on so called geoJSON files it will generate HTML files visualizing the data on a map including interactive control of scroll/pan and zoom of the map. The geoJSON file contains the outline of regions based on the GPS location and maps them on a basemap. E.g. OpenStreetMap (OSM) can be used as a basemap. This is an example of such a map:
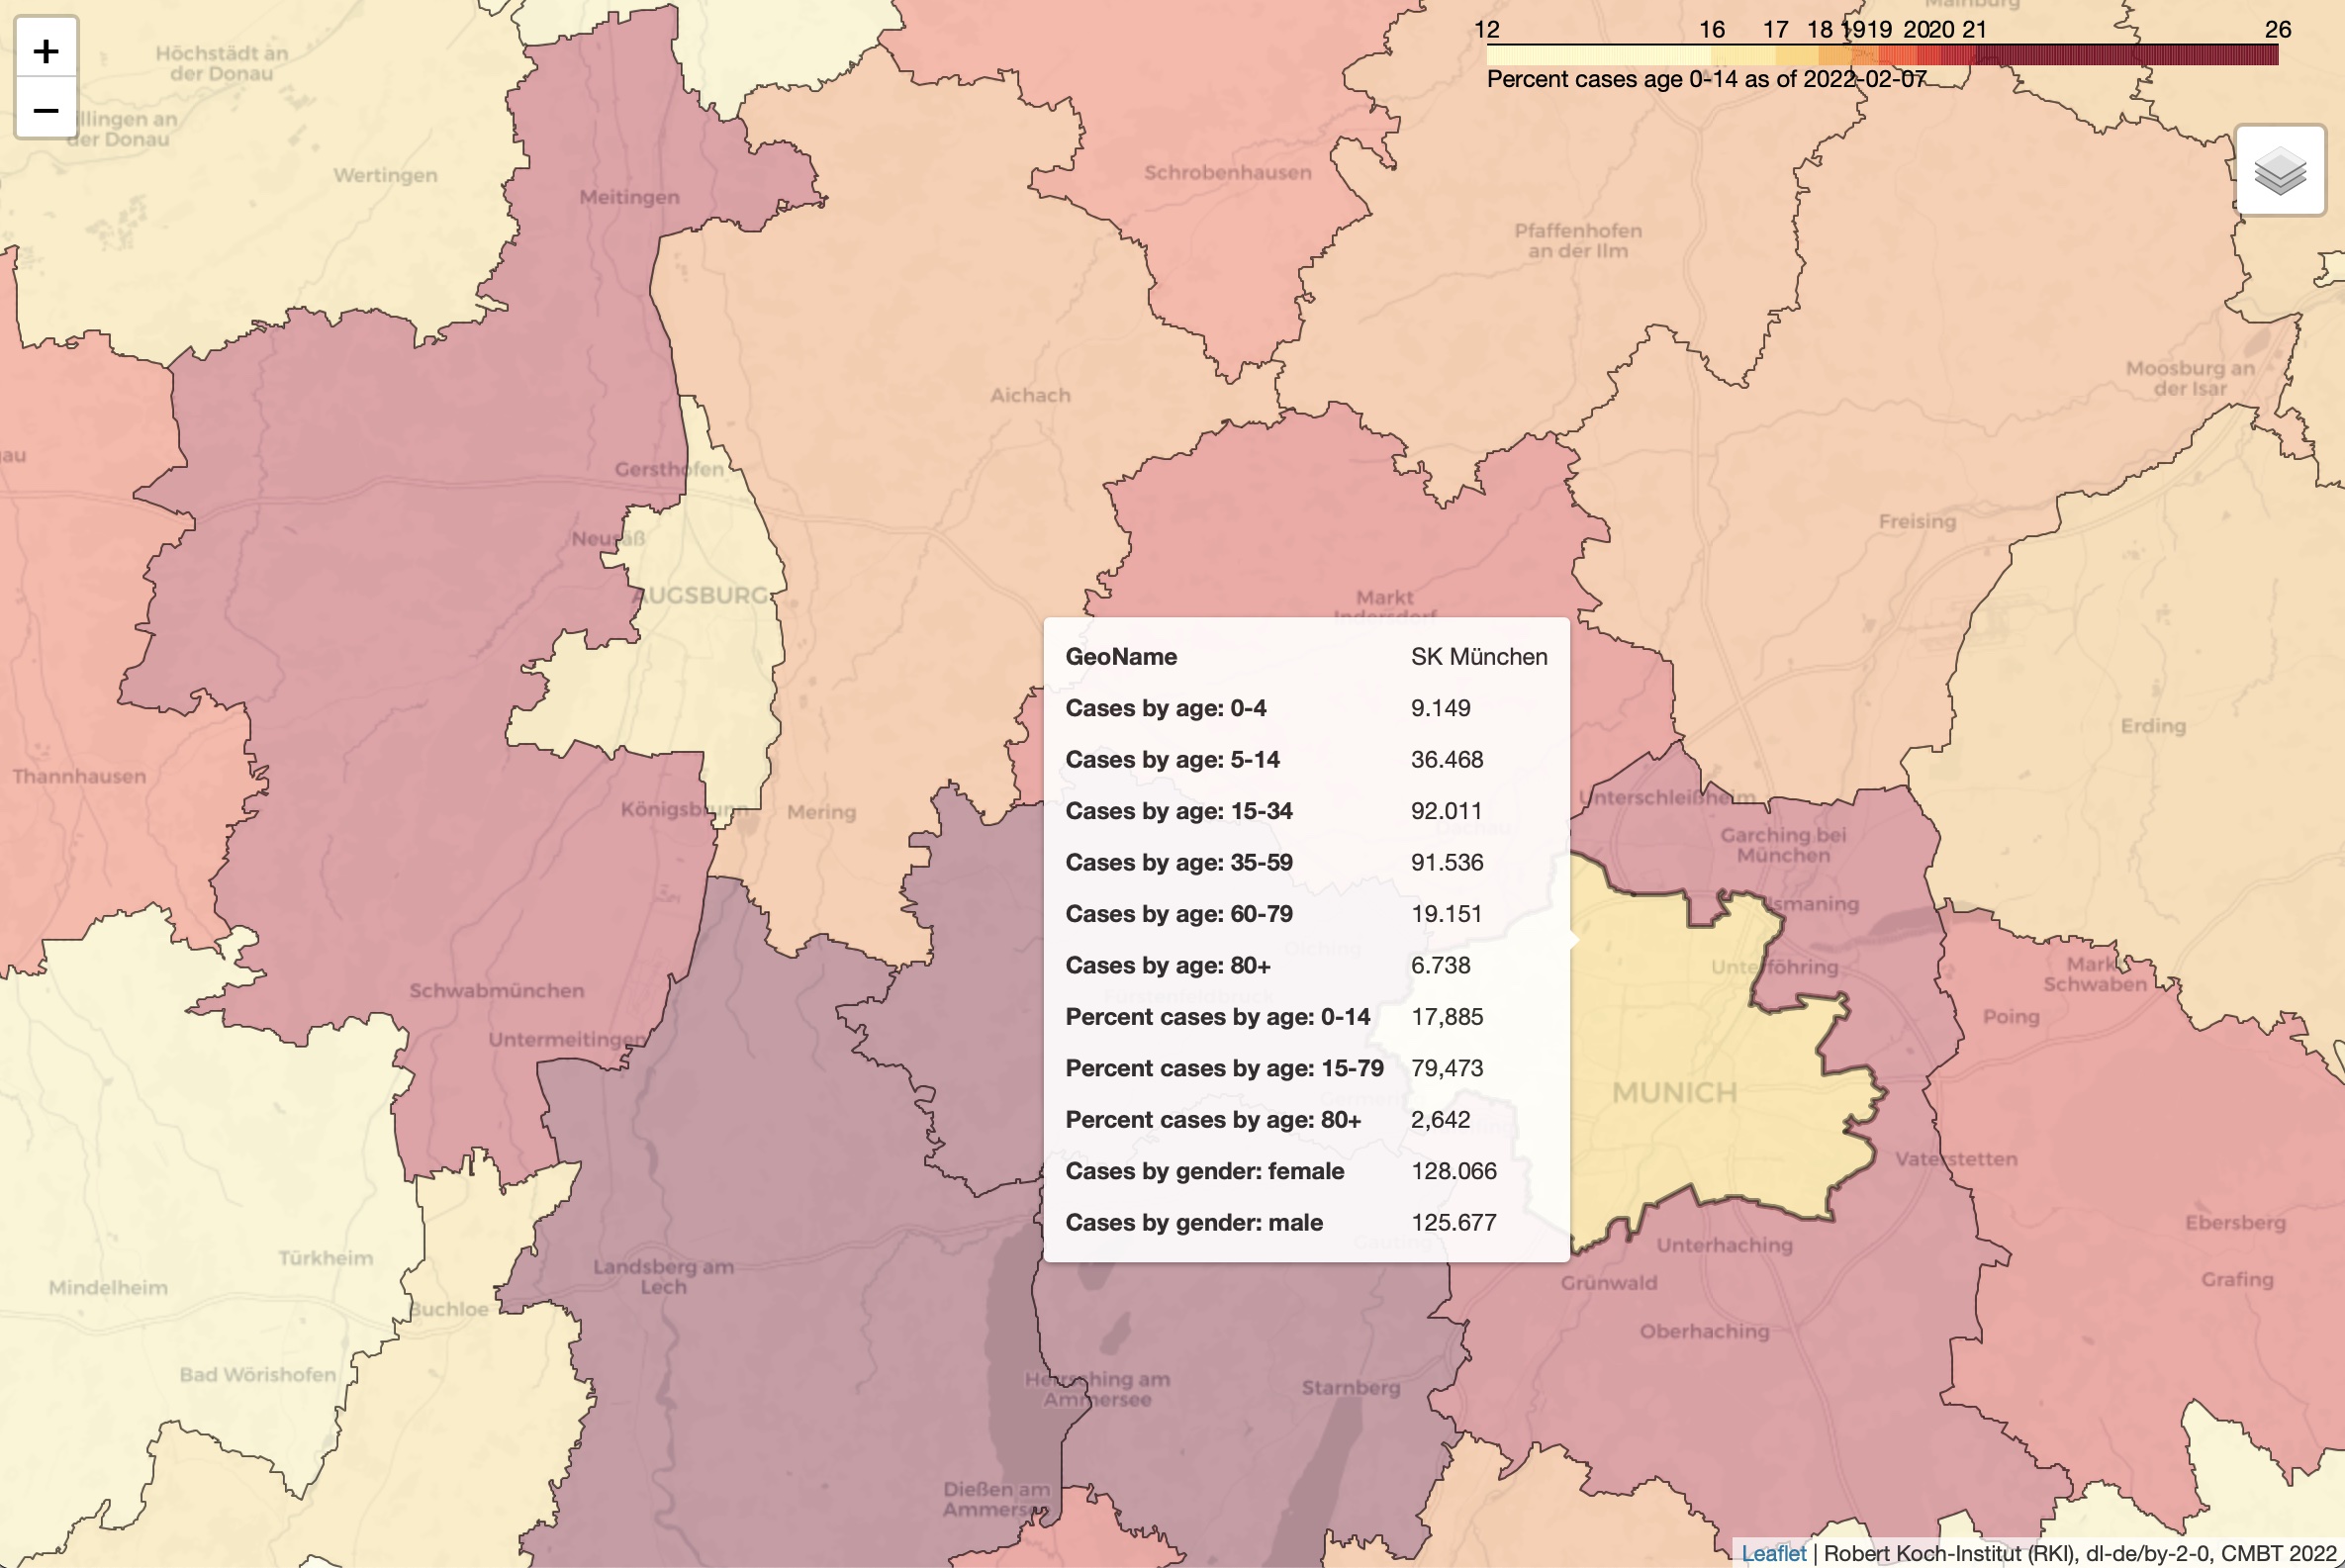
A geo data source for Germany is for example the Bundesamt für Kartographie und Geodäsie with the wfs_vg250-ew data of counties and their population. Another source for geoJSON data is provided by the OpenDataLab with very good county, city or even village geo data including different meta information.
Of course you will also find Folium maps that are showing the data generated by our CovidCasesWHO and CovidCasesOWID classes to give you a quick overview of the world wide (or a selectable continent) situation. Except as for Taiwan the data shown here is based on the WHO but for Taiwan Our World In Data is being used (the WHO doesn’t provide data for Taiwan). As you can see it uses a different basemap. This one here is the World_Dark_Gray_Base map from arcGIS Online:
Be aware viewing the maps might involve a longer load time as the HTML file includes the data to be visualized as well. If you want you can save the HTML file and present it on your own website.
The source code also includes a Google Colab compatible Jupyter Notebook that allows you to execute it on the Google servers.
All updated source code can be downloaded from our Covid-19 analysis repository on GitHub. The source files are documented well but we also plan to publish a separate documentation here.