The REST API version 5.2
Content#
As our project includes a REST API we want to explain how to use it. So far we implemented three methods to use it. One is running a local web server and using a browser, the others are to use CSharp under Windows or Swift under MacOS to get the data from the server. This leads to the three topics discussed in this post.
If you haven’t installed Python on your machine you may do it now. As well you might learn about finalizing the setup of the development system after installing Python. This are the topics we will discuss here:
- Using the REST API in a browser
- Using CSharp to access the REST API
- Using Swift to access the REST API
Attention on December 14th. the ECDC decided to stop providing daily numbers on the Covid-19 outbreak so we had to switch to WHO data. Even if the WHO data is pretty close to the ECDC data there are some differences. The WHO for instance does not provide any information about Taiwan. To overcome the problem you may want to use the OWID data that is listing Taiwan as well. You can read about the quality of the different data source here, it’s worth to read it.
With the release of version 5.2 the REST API supports both, the WHO and the OWID dat sets.
Using the REST API in a browser#
Now we want to make use of the REST API to access the data using the browser. This will allow us to integrate graphs in a web site. Expand the rest folder and open the file named app.py:
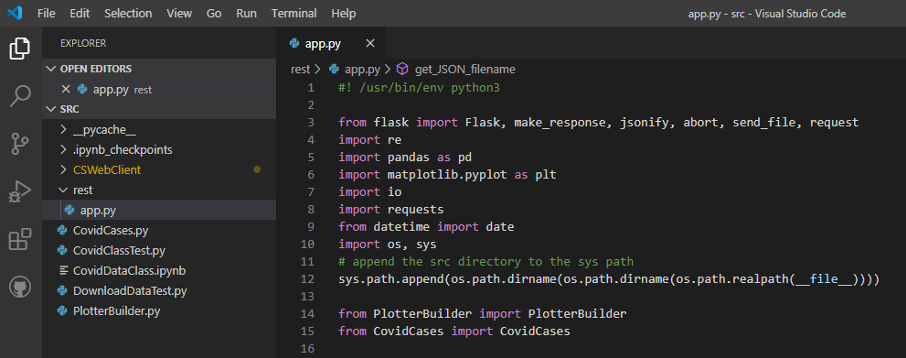
To execute the file use terminal and switch to the Covid-19-Analysis/src/rest directory and start uvicorn using the following command:
uvicorn app:app
Start your browser and connect to http://localhost:8000/api/data/DE,UK/Cases? to show a graph of daily cases in Germany and the UK. To stop uvicorn switch back to your terminal and press CTRL + C.
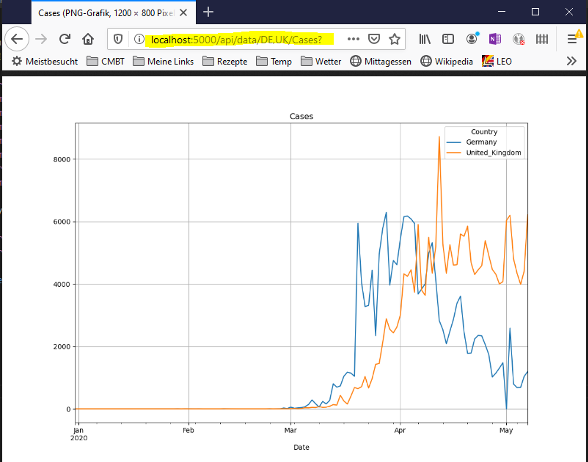
The browser will connect to your local server and of course you can connect to it from a separate machine using the IP address of your local system. You may also use our own web server: try this link mb.cmbt.de/api/data/DE,UK/Cases?. If you connect to mb.cmbt.de/docs you will find a simplified user interface to test the REST API.
The options of the address are as follow:
‘http://localhost:5000/api/data/GeoIDlist/Field?ParameterOptions’
| Part | Description |
|---|---|
| GeoIDlist | the comma separated list of GeoIDs of countries you want to get the data for. E.g. DE,UK,FR |
| Field | The data field that you want to display: |
| Cases: The overall number of confirmed infections (here called cases) since December 31st. 2019 as pubished by the ECDC | |
| DailyCases: The daily number of confirmed cases | |
| DailyCases7: The average number of DailyCases of the last 7 days | |
| Deaths: The overall number of deaths of confirmed cases | |
| DailyDeaths: The daily number of deaths of confirmed cases | |
| DailyDeaths7: The 7-day average of the daily number of deaths | |
| PercentDeaths: The percentage of deaths of the confirmed cases. This is also called Case-Fatality-Rate (CFR) which is an estimation for the Infection-Fatality-Rate (IFR) which also includes unconfirmed (hidden or dark) infections | |
| DoublingTime: The time in days after which the number of Cases are doubled | |
| DoublingTime7: The time in days after which the number of Cases are doubled as a 7 day average | |
| CasesPerMillionPopulation: The number of Cases divided by the population in million | |
| DeathsPerMillionPopulation: The number of Deaths divided by the population in million | |
| R: An estimation for the reproduction number R | |
| R7: An estimation for the reproduction number R in a 7-day average | |
| Incidence7DayPer100Kpopulation: The accumulated 7-day incidence. That is the sum of the daily cases of the last 7 days divided by the population in 100000 people | |
| PeopleReceivedFirstDose: Number of citizens that received first vaccination dose | |
| PercentPeopleReceivedFirstDose: Percent of citizens that received first vaccination dose | |
| PeopleReceivedAllDoses: Number of citizens that received all vaccination doses | |
| PercentPeopleReceivedAllDoses: Percent of citizens that received all vaccination doses | |
| VaccineDosesAdministered: The overall number of vaccination doses that have been administered | |
| DailyVaccineDosesAdministered7DayAverage: The daily number of vaccination doses that have been administered in a seven day average | |
| Parameter | Either no parameter or one of the following: |
| sinceN=X | The number of cases since the X number of cases was exceeded. E.g. sinceN=100 |
| lastN=X | To show the last X number of days. E.g. lastN=30 |
| dataSource=X | The data source to be used. Can be WHO or OWID.. E.g. dataSource=WHO |
| Options | None or one or a combination of the following: |
| log=True | To show a logarithmic y axis |
| axisbar=True | To show a bar graph |
Examples you can try that are executed on the mb.cmbt.de server:
- http://mb.cmbt.de/api/data/DE%2CUK/Incidence7DayPer100Kpopulation?lastN=30&bar=true
- http://mb.cmbt.de/api/data/DE%2CFR%2CIT/Cases?sinceN=500&log=true&bar=false
Using CSharp to access the REST API#
Using REST APIs is simple. Try to open this link to the Google QR code web service
It will show a QR code containing the string "Hello World". You can find more information about the Google APIs here
The repository includes a subdirectory called CSWebClient. Here you will find a full sample that you can build and execute. Open the sample in Visual Studio and hit F5 to start it. Select the countries you want to see and click Get data. The sample will shows the address that it is using in the status line, connect to the server that is still running under Python and displays the result:
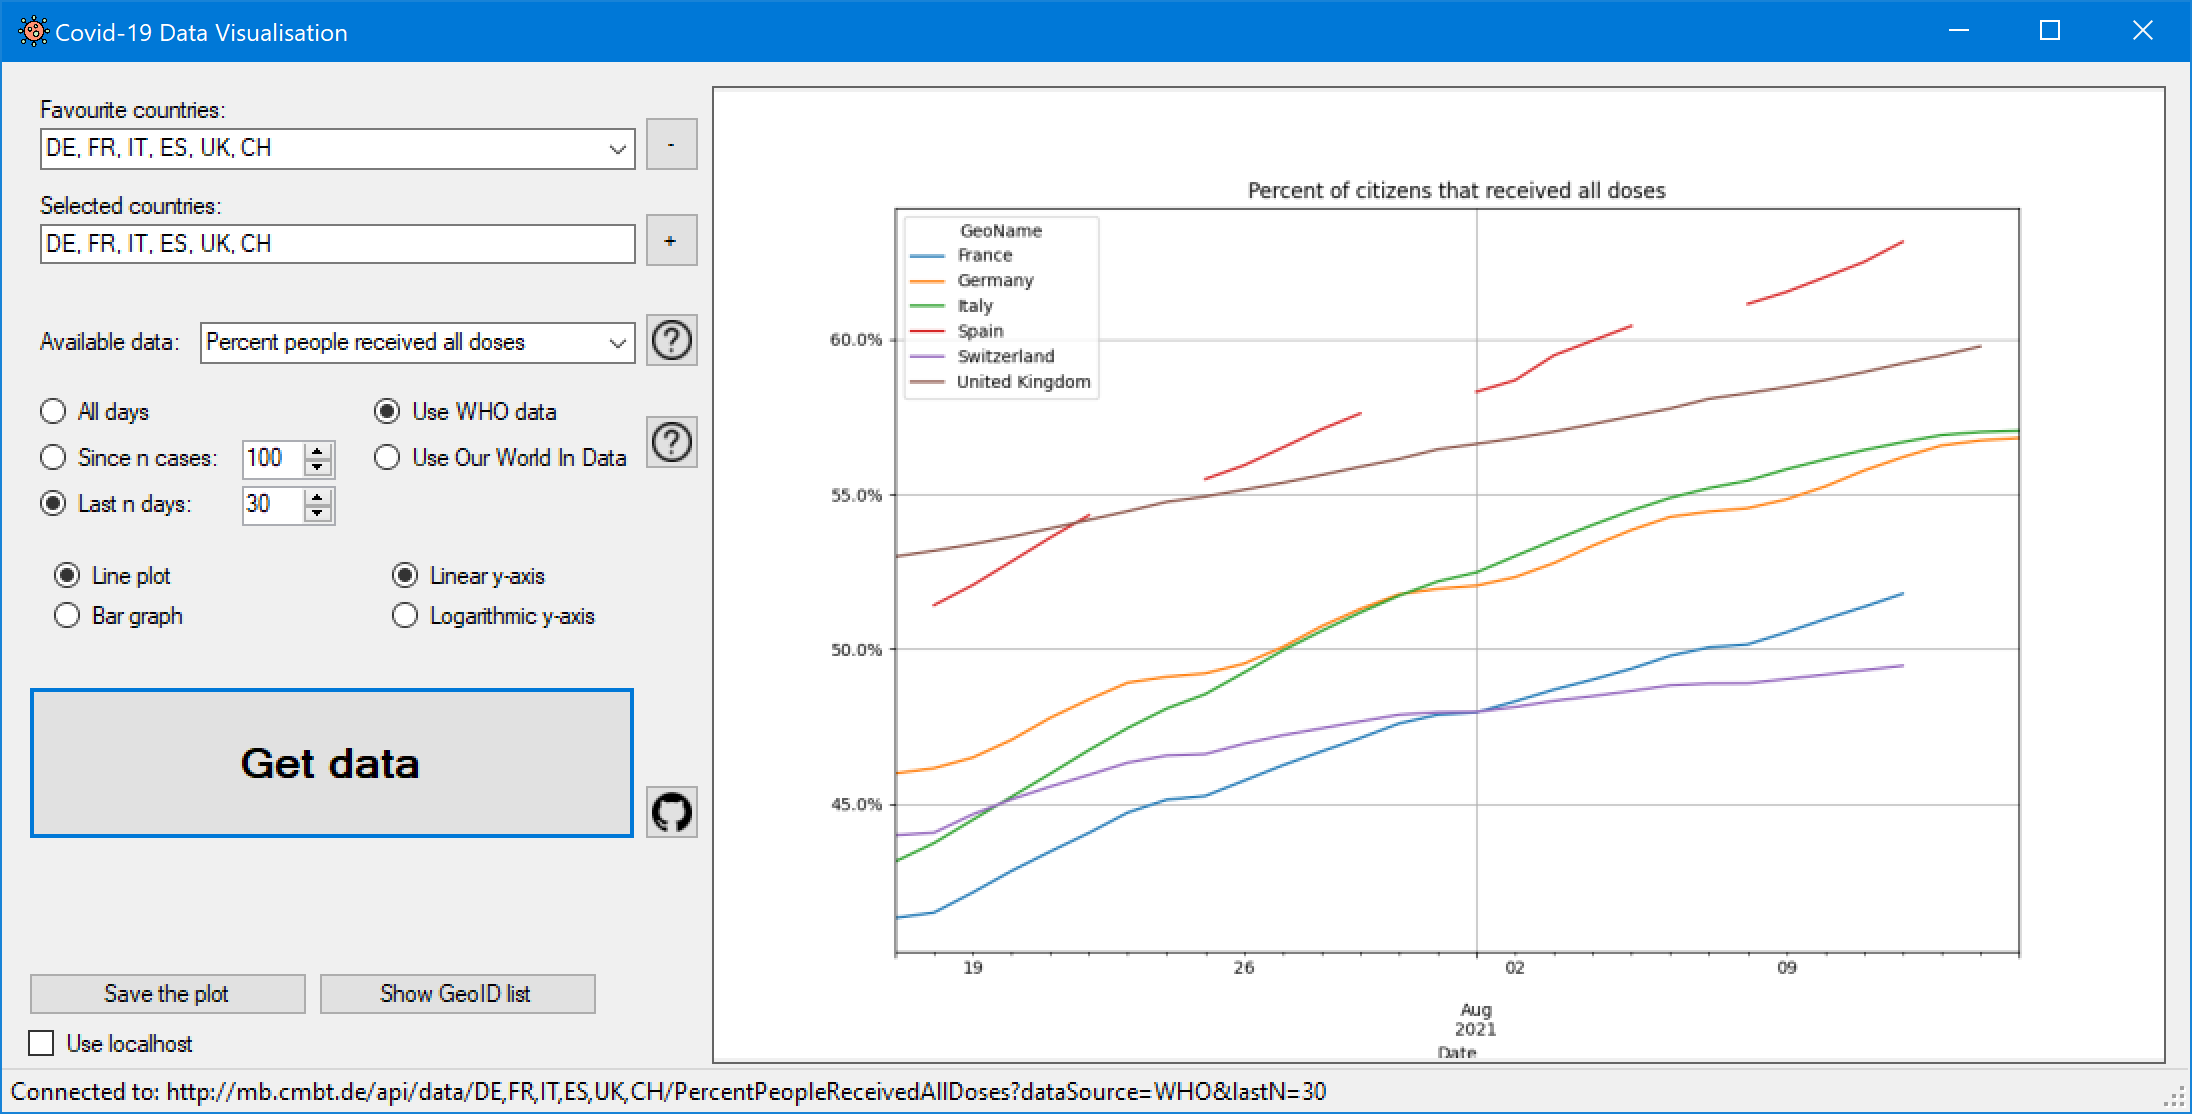
Most of the job of the sample is to create the URL that is used to get the data from. The function that returns a Bitmap from the URL is pretty simple:
private System.Drawing.Bitmap GetChartFromURL(string strURL)
{
   // the result
   System.Drawing.Bitmap result = null;
   // create a web client
   System.Net.WebClient wc = new System.Net.WebClient();
   // download image data
   Byte[] image = wc.DownloadData(strURL);
   // put it in a stream
   System.IO.MemoryStream stream = new System.IO.MemoryStream(image);
   // create image from stream
   result = new System.Drawing.Bitmap(stream);
   return result;
}
It’s up to you what you do with this image, but using it is simple.
Using Swift to access the REST API#
Like in C# it’s simple to use a REST API under Swift. The Covid-19 Anaysis repository on GitHub includes a subdirectory called Covid19WebClient. Here you will find a full sample that you can build and execute. Open the sample in XCode and hit ⌘ R to start it. Select the countries you want to see or select one of the favorites and click Retrieve Plot to get the data. The sample will show the address that it is using in the status line, connect to the mb.cmbt.de website that is running the REST API under Python and display the result:
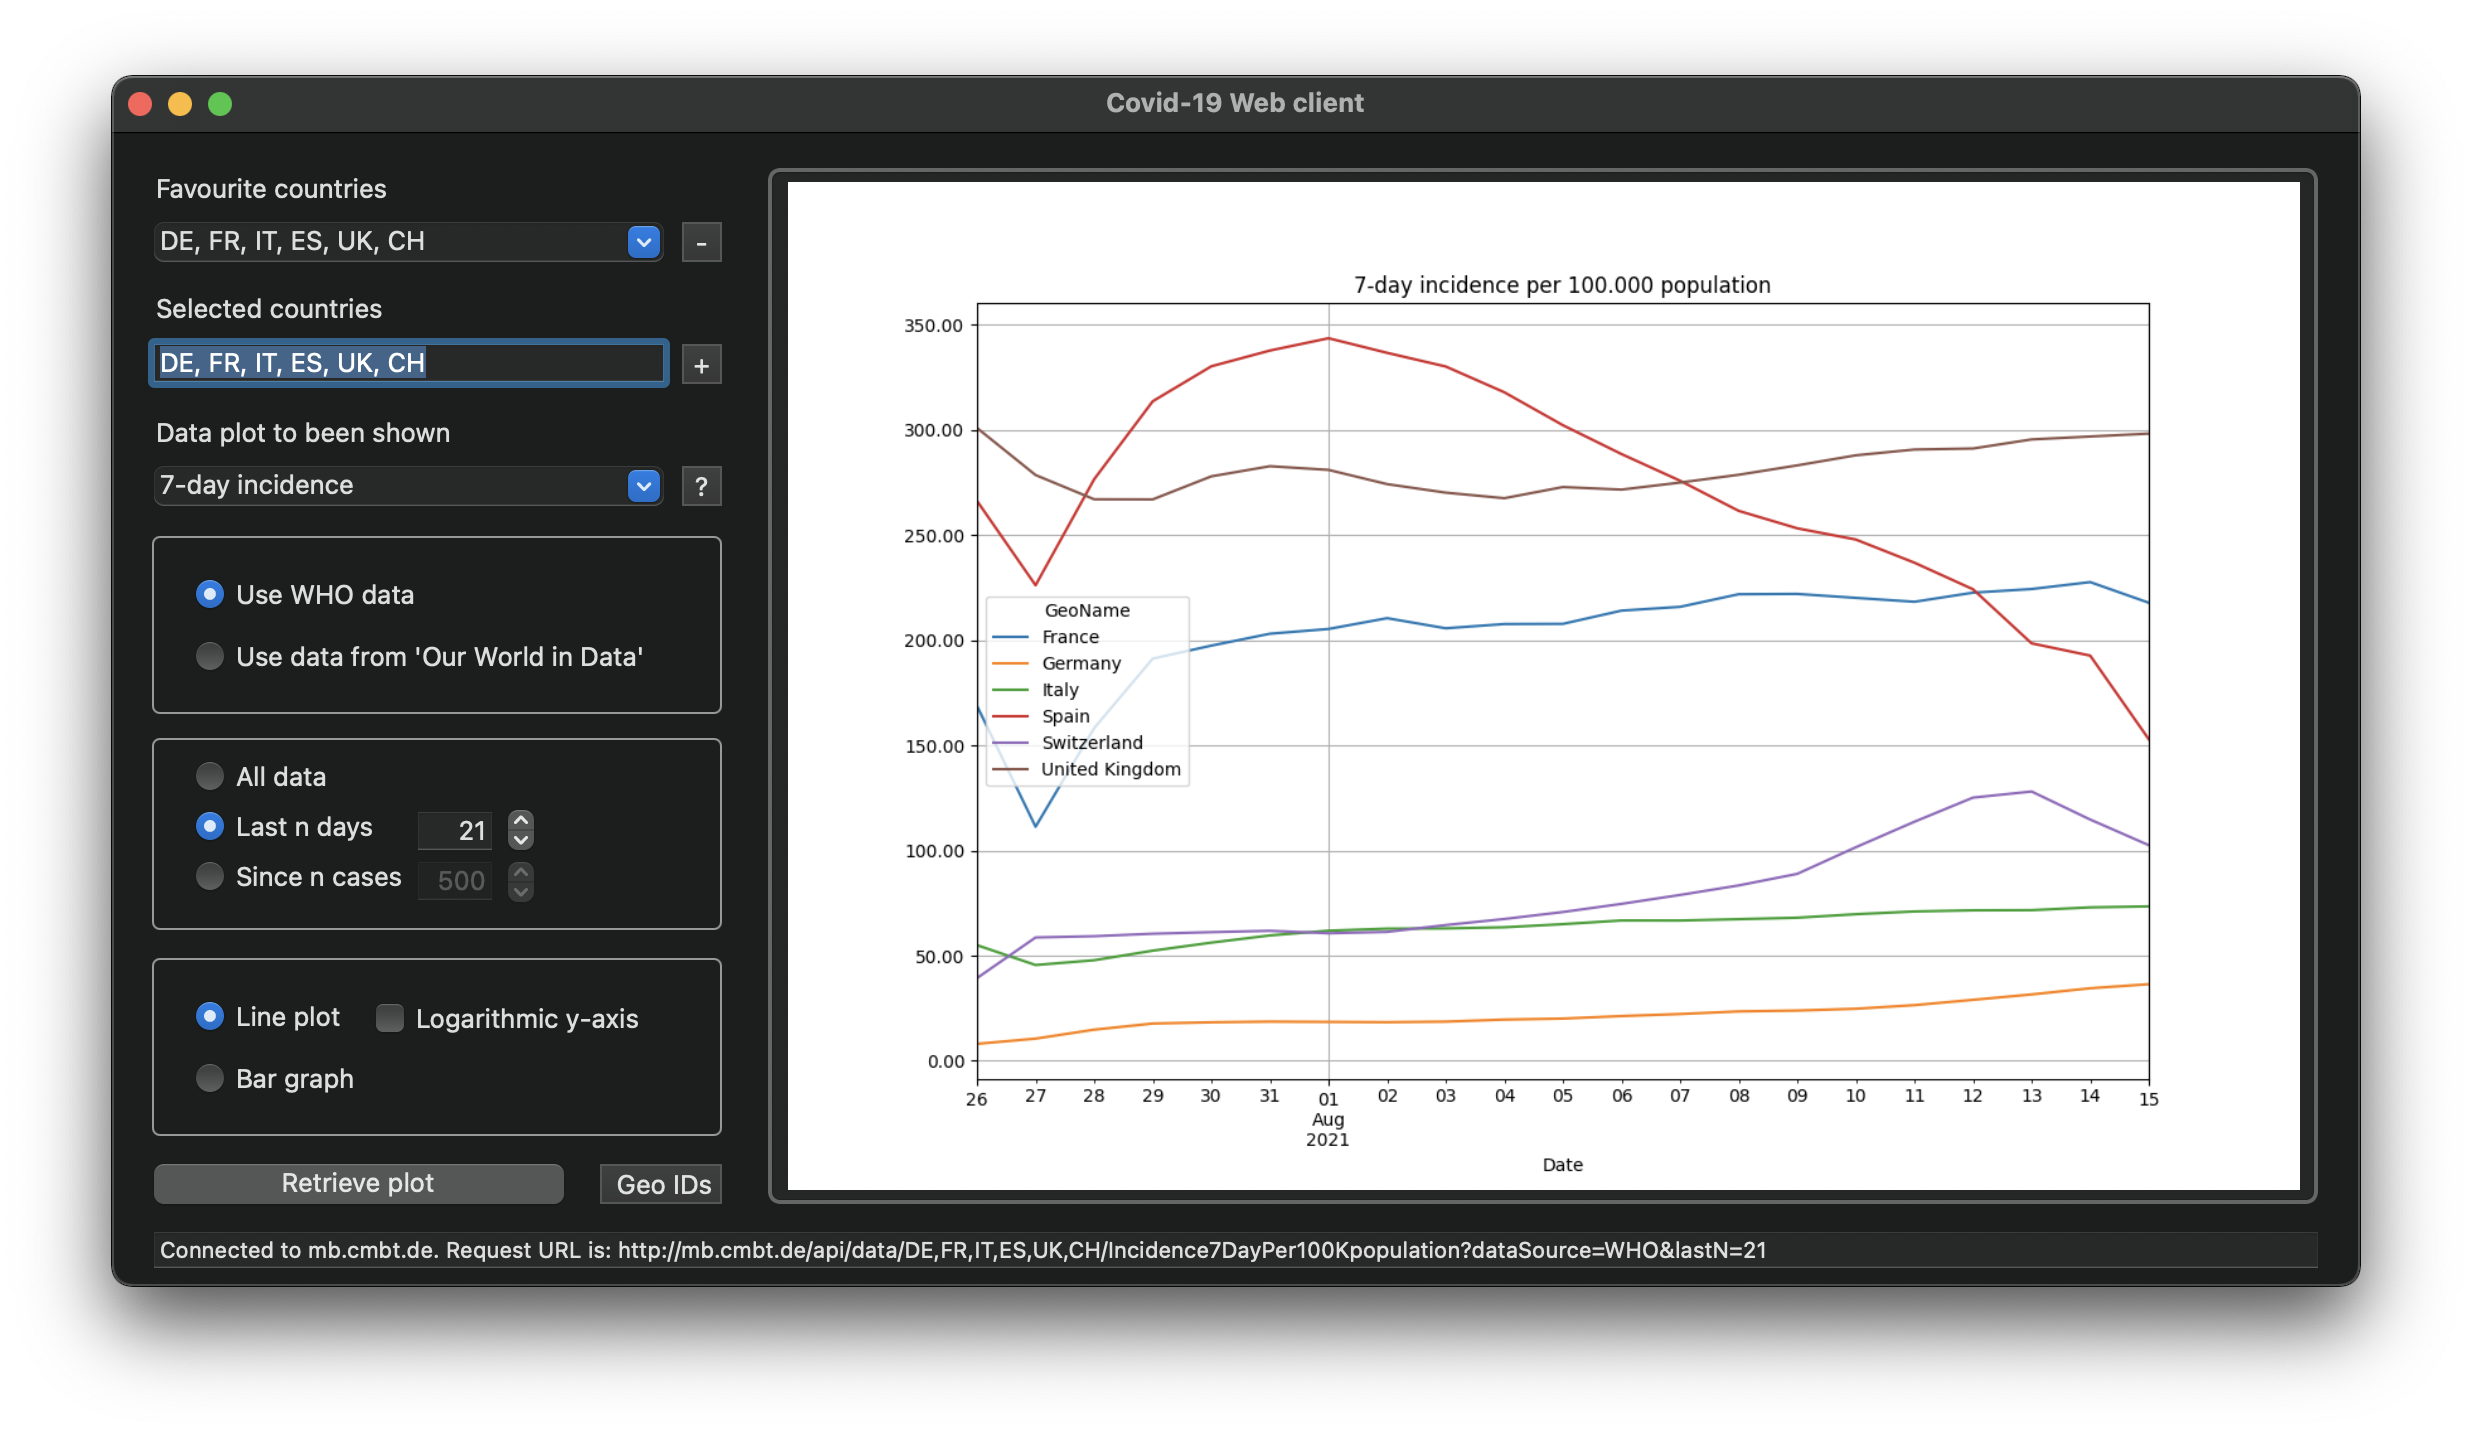
As in C# most of the job of the sample is to create the URL that is used to get the data from. The function that returns a NSImage from the URL is pretty simple:
private func GetChartFromURL(strURL: String) -> Result<NSImage, NetworkError> {
    // the url
    guard let url = URL(string: strURL) else {
      // there is a problem with the url
      return Result.failure(NetworkError.INVALID_URL)
    }
    // get the image from the url
    do {
      if let result = try NSImage(data: Data(contentsOf: url)) {
        // great, it worked, return the image
        return Result.success(result)
      }
      // obviously the server did not returned an imahe
      return Result.failure(NetworkError.INVALID_RESPONSE)
    }
    catch {
      // we got no answer at all
      return Result.failure(NetworkError.NO_RESPONSE)
    }
  }
You will notice that the function actually returns one of two different result types, a nice feature of Swift that is covered by the Swift type Result. The Result type has two cases: success and failure. Both are generics so you can define what there values are. For success we return a NSImage, but failuremust confirm to Swift’s error protocol and that’s an enum. We use NetworkError and it’s defined by this:
  enum NetworkError:Error {
    /// Something is wrong with the URL, potentially it's because of the App Transport Security Settings (no http connections allowed) or the sandboxing
    case INVALID_URL
    /// The server is not responding
    case NO_RESPONSE
    /// The server does not respond data of the expected type (e.g. no image)
    case INVALID_RESPONSE
  }
Having the return type in place we can call GetChartFromURL e.g. like in this function:
func GetDataChartLast(strCountries: String, strAttribut: String, bLogarithmic: Bool, bBargraph: Bool, nLast: Int32) -> (image: Result<NSImage, NetworkError>, strURL: String)
  {
    // build the url string
    var strURL: String = "http";
    if (_UseHTTPS) {
      strURL = strURL + "s"
    }
    // remove spaces from the GeoID string list
    let strCountriesNoSpaces = strCountries.replacingOccurrences(of: " ", with: "")
    // add these GeoID list to the url
    strURL = strURL + "://" + _server + _urlPath + strCountriesNoSpaces + "/" + strAttribut + "?dataSource=" + DataSource.rawValue + "&lastN=" + String(nLast)
    // add the log flag
    if (bLogarithmic) {
      strURL = strURL + "&log=True"
    }
    // add the bargraph flag
    if (bBargraph) {
      strURL = strURL + "&bar=True"
    }
    // finally get the image and the url that has been used from the server
    return (GetChartFromURL(strURL: strURL), strURL)
  }
This function seems to be even more strange as it returns a tuple of values of which one is the result of GetChartFromURL (a NSImage or the NetworkError type). The second value of the tuple is the URL that has been used to get the data.
Using this becomes obvious when we look at the function that is finally using the result and that is in the ViewController:
...
// now get the data
var theResult: (image: Result<NSImage, CoronaWebClient.NetworkError>, strURL: String)
switch _dateOption {
   case 0:
      // get the data
      theResult = _wc.GetDataChart(strCountries: theGeoIDs, strAttribut: theAttribute, bLogarithmic: logarithmic, bBargraph: barGraph)
   case 1:
      // get the data
      theResult = _wc.GetDataChartLast(strCountries: theGeoIDs, strAttribut: theAttribute, bLogarithmic: logarithmic, bBargraph: barGraph, nLast: stpLastNDays.intValue)
   case 2:
      // get the data
      theResult = _wc.GetDataChartSince(strCountries: theGeoIDs, strAttribut: theAttribute, bLogarithmic: logarithmic, bBargraph: barGraph, nSince: stpSinceNCases.intValue)
   default:
      return
}
...
It basically defines theResultas the return type of the function and than calls it. Checking theResultis than done like in this snippet:
...
// check the return
switch theResult {
   // success
   case let (Result.success(image), url):
      imageView.image = image
      txtStatus.stringValue = "Connected to " + _strServer + ". Request URL is: " + url
      // enable the menu items to save and copy the plot
      enableMenuItems()
   // server not found at all
   case let (Result.failure(CoronaWebClient.NetworkError.INVALID_URL), url):
      txtStatus.stringValue = "Error connecting to " + _strServer + ". Request URL is: " + url
   // server returned no image
   case let (Result.failure(CoronaWebClient.NetworkError.INVALID_RESPONSE), url):
      txtStatus.stringValue = "Error in server reply. Request URL is: " + url + ". Maybe server doesn't send an image."
   // server doesn't respond
   case let (Result.failure(CoronaWebClient.NetworkError.NO_RESPONSE), url):
      txtStatus.stringValue = "Error server didn't respond. Request URL is: " + url + ". Maybe an illegal GeoID?"
}
...
Both language, C# and Swift, are using pretty modern approaches to force you to write less defective code and give you good instruments to do so.